Xây dựng bảng điều khiển theo dõi thị trường với Dash và Plotly
2024-03-12 — Hướng Nghiệp Dữ Liệu
Tóm tắt nhanh: Hướng dẫn sử dụng Dash và Plotly để xây dựng bảng điều khiển theo dõi thị trường thời gian thực
Giới thiệu
Trong thời đại số hóa, việc theo dõi và phân tích thị trường tài chính một cách hiệu quả đã trở thành nhu cầu thiết yếu đối với các nhà đầu tư và giao dịch viên. Một bảng điều khiển (dashboard) thị trường tương tác không chỉ giúp trực quan hóa dữ liệu mà còn cho phép người dùng tương tác và phân tích thông tin một cách nhanh chóng và hiệu quả.
Dash và Plotly là hai công cụ mạnh mẽ trong hệ sinh thái Python, đặc biệt phù hợp để xây dựng các ứng dụng web trực quan hóa dữ liệu tương tác mà không cần kiến thức sâu về phát triển web. Bài viết này sẽ hướng dẫn bạn cách xây dựng một bảng điều khiển theo dõi thị trường tài chính hoàn chỉnh sử dụng Dash và Plotly, từ thiết kế ban đầu đến triển khai ứng dụng thực tế.
I. Tổng quan về Dash và Plotly
Dash là gì?
Dash là một framework Python mã nguồn mở được phát triển bởi Plotly, cho phép xây dựng các ứng dụng web phân tích dữ liệu tương tác mà không cần kiến thức JavaScript. Dash được xây dựng trên nền tảng Flask, Plotly.js và React.js, kết hợp sức mạnh của các công nghệ này để tạo ra một công cụ mạnh mẽ nhưng đơn giản để sử dụng.
Plotly là gì?
Plotly là thư viện trực quan hóa dữ liệu cung cấp các biểu đồ tương tác chất lượng cao. Plotly.py là phiên bản Python của Plotly, cho phép tạo ra các biểu đồ đẹp mắt và tương tác trong Python.
Lợi ích của việc sử dụng Dash và Plotly
- Tương tác mạnh mẽ: Người dùng có thể tương tác với dữ liệu thông qua các thành phần như dropdown, slider, checkbox.
- Đa dạng biểu đồ: Plotly hỗ trợ hơn 40 loại biểu đồ khác nhau, từ đơn giản đến phức tạp.
- Phát triển nhanh chóng: Xây dựng ứng dụng web chỉ với Python, không cần HTML, CSS, JavaScript.
- Khả năng mở rộng: Dễ dàng nâng cấp từ nguyên mẫu (prototype) thành ứng dụng cấp sản phẩm.
- Tích hợp tốt: Hoạt động liền mạch với các thư viện phân tích dữ liệu Python khác như Pandas, NumPy, scikit-learn.
II. Cài đặt môi trường và các công cụ cần thiết
Cài đặt thư viện
pip install dash dash-bootstrap-components plotly pandas yfinance ta
Các thư viện chính và chức năng:
- dash: Framework chính để xây dựng ứng dụng web
- dash-bootstrap-components: Thành phần Bootstrap cho Dash
- plotly: Thư viện trực quan hóa
- pandas: Xử lý và phân tích dữ liệu
- yfinance: Lấy dữ liệu thị trường từ Yahoo Finance
- ta: Tính toán các chỉ báo phân tích kỹ thuật
III. Thu thập và chuẩn bị dữ liệu
1. Thu thập dữ liệu thị trường
import yfinance as yf
import pandas as pd

def get_stock_data(ticker, period="1y", interval="1d"):
    """
    Lấy dữ liệu cổ phiếu từ Yahoo Finance

    Parameters:
    -----------
    ticker : str
        Mã cổ phiếu
    period : str
        Khoảng thời gian (1d, 5d, 1mo, 3mo, 6mo, 1y, 2y, 5y, 10y, ytd, max)
    interval : str
        Khoảng thời gian giữa các điểm dữ liệu (1m, 2m, 5m, 15m, 30m, 60m, 90m, 1h, 1d, 5d, 1wk, 1mo, 3mo)

    Returns:
    --------
    pd.DataFrame
        DataFrame chứa dữ liệu OHLCV
    """
    data = yf.download(ticker, period=period, interval=interval)
    return data

# Ví dụ: Lấy dữ liệu của Apple
aapl_data = get_stock_data("AAPL", period="1y")
2. Tính toán chỉ báo kỹ thuật
import ta

def add_technical_indicators(df):
    """
    Thêm các chỉ báo kỹ thuật vào DataFrame

    Parameters:
    -----------
    df : pd.DataFrame
        DataFrame chứa dữ liệu OHLCV

    Returns:
    --------
    pd.DataFrame
        DataFrame với các chỉ báo kỹ thuật đã được thêm vào
    """
    # Tạo bản sao để không thay đổi dữ liệu gốc
    df_with_indicators = df.copy()

    # Thêm chỉ báo xu hướng
    df_with_indicators['SMA20'] = ta.trend.sma_indicator(df['Close'], window=20)
    df_with_indicators['SMA50'] = ta.trend.sma_indicator(df['Close'], window=50)
    df_with_indicators['SMA200'] = ta.trend.sma_indicator(df['Close'], window=200)
    df_with_indicators['EMA20'] = ta.trend.ema_indicator(df['Close'], window=20)

    # Thêm chỉ báo khối lượng
    df_with_indicators['VWAP'] = ta.volume.volume_weighted_average_price(
        df['High'], df['Low'], df['Close'], df['Volume']
    )

    # Thêm chỉ báo dao động
    df_with_indicators['RSI'] = ta.momentum.rsi(df['Close'], window=14)
    df_with_indicators['MACD'] = ta.trend.macd(df['Close'])
    df_with_indicators['MACD_Signal'] = ta.trend.macd_signal(df['Close'])
    df_with_indicators['MACD_Diff'] = ta.trend.macd_diff(df['Close'])

    # Thêm Bollinger Bands
    bollinger = ta.volatility.BollingerBands(df['Close'], window=20, window_dev=2)
    df_with_indicators['BB_Upper'] = bollinger.bollinger_hband()
    df_with_indicators['BB_Lower'] = bollinger.bollinger_lband()
    df_with_indicators['BB_MA'] = bollinger.bollinger_mavg()
    df_with_indicators['BB_Width'] = bollinger.bollinger_wband()

    return df_with_indicators

# Thêm chỉ báo vào dữ liệu Apple
aapl_with_indicators = add_technical_indicators(aapl_data)
3. Lấy dữ liệu từ nhiều mã cổ phiếu
def get_multiple_stocks(tickers, period="1y"):
    """
    Lấy dữ liệu từ nhiều mã cổ phiếu

    Parameters:
    -----------
    tickers : list
        Danh sách các mã cổ phiếu
    period : str
        Khoảng thời gian

    Returns:
    --------
    dict
        Dictionary chứa DataFrame của từng mã
    """
    data = {}
    for ticker in tickers:
        data[ticker] = get_stock_data(ticker, period=period)

    return data

# Ví dụ: Lấy dữ liệu của các công ty công nghệ lớn
tech_tickers = ["AAPL", "MSFT", "GOOGL", "AMZN", "META"]
tech_stocks = get_multiple_stocks(tech_tickers)
IV. Thiết kế cấu trúc bảng điều khiển
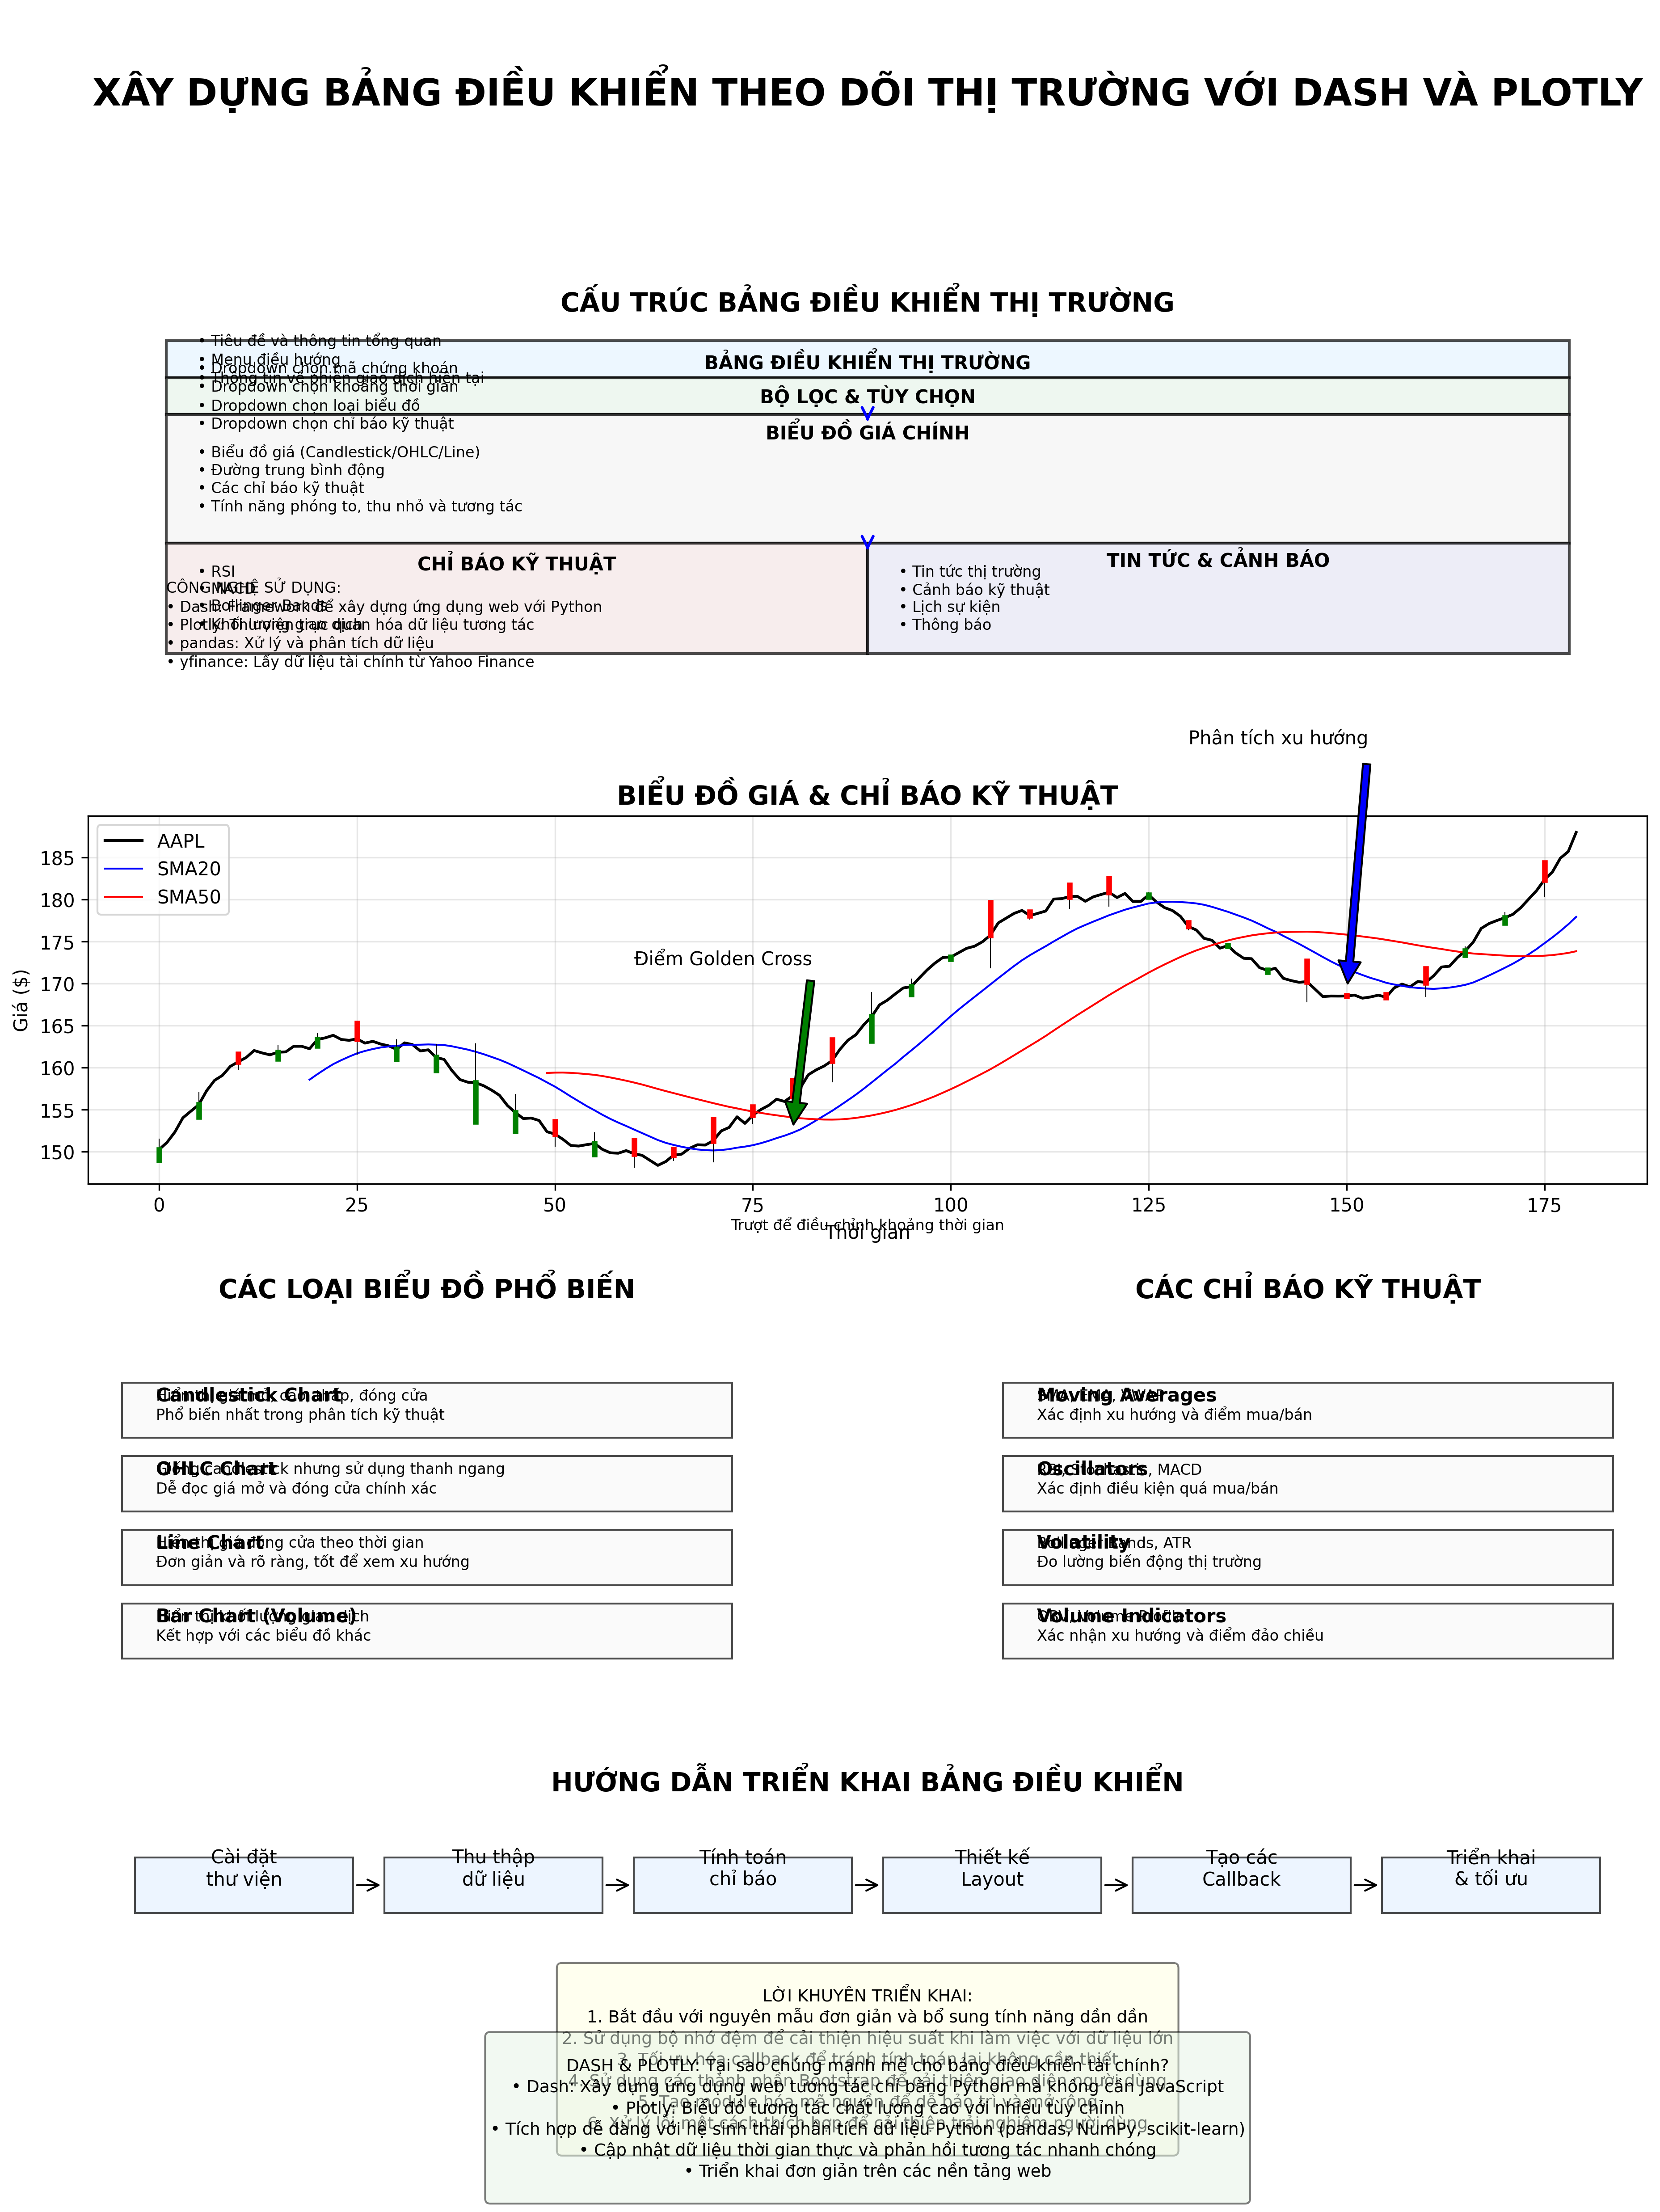
Một bảng điều khiển thị trường hiệu quả cần bao gồm các thành phần sau:
1. Layout tổng thể
import dash
from dash import html, dcc
import dash_bootstrap_components as dbc

# Khởi tạo ứng dụng Dash
app = dash.Dash(__name__, external_stylesheets=[dbc.themes.BOOTSTRAP])

# Tạo layout cho ứng dụng
app.layout = dbc.Container([
    # Header
    dbc.Row([
        dbc.Col(html.H1("Bảng điều khiển theo dõi thị trường", className="text-center p-4"), width=12)
    ]),

    # Bộ lọc và điều khiển
    dbc.Row([
        dbc.Col([
            html.Label("Chọn mã chứng khoán:"),
            dcc.Dropdown(
                id="ticker-dropdown",
                options=[{"label": ticker, "value": ticker} for ticker in tech_tickers],
                value="AAPL"
            )
        ], width=3),

        dbc.Col([
            html.Label("Chọn khoảng thời gian:"),
            dcc.Dropdown(
                id="timeframe-dropdown",
                options=[
                    {"label": "1 tháng", "value": "1mo"},
                    {"label": "3 tháng", "value": "3mo"},
                    {"label": "6 tháng", "value": "6mo"},
                    {"label": "1 năm", "value": "1y"},
                    {"label": "2 năm", "value": "2y"},
                    {"label": "5 năm", "value": "5y"},
                ],
                value="1y"
            )
        ], width=3),

        dbc.Col([
            html.Label("Chọn loại biểu đồ:"),
            dcc.Dropdown(
                id="chart-type-dropdown",
                options=[
                    {"label": "Candlestick", "value": "candlestick"},
                    {"label": "Line", "value": "line"},
                    {"label": "OHLC", "value": "ohlc"}
                ],
                value="candlestick"
            )
        ], width=3),

        dbc.Col([
            html.Label("Chọn chỉ báo kỹ thuật:"),
            dcc.Dropdown(
                id="indicator-dropdown",
                options=[
                    {"label": "Bollinger Bands", "value": "bollinger"},
                    {"label": "Moving Averages", "value": "ma"},
                    {"label": "RSI", "value": "rsi"},
                    {"label": "MACD", "value": "macd"},
                    {"label": "Tất cả", "value": "all"},
                    {"label": "Không", "value": "none"},
                ],
                value="ma",
                multi=True
            )
        ], width=3),
    ], className="mb-4"),

    # Biểu đồ giá và khối lượng chính
    dbc.Row([
        dbc.Col([
            html.H4("Biểu đồ giá", className="text-center"),
            dcc.Graph(id="main-chart")
        ], width=12)
    ], className="mb-4"),

    # Bảng điều khiển chỉ báo kỹ thuật
    dbc.Row([
        dbc.Col([
            html.H4("Chỉ báo kỹ thuật", className="text-center"),
            dcc.Graph(id="technical-indicators")
        ], width=12)
    ], className="mb-4"),

    # Bảng tổng quan thị trường và so sánh ngành
    dbc.Row([
        dbc.Col([
            html.H4("Tổng quan thị trường", className="text-center"),
            dcc.Graph(id="market-overview")
        ], width=6),

        dbc.Col([
            html.H4("So sánh ngành", className="text-center"),
            dcc.Graph(id="sector-comparison")
        ], width=6)
    ], className="mb-4"),

    # Bảng thông tin chi tiết và tin tức
    dbc.Row([
        dbc.Col([
            html.H4("Thông tin chi tiết", className="text-center"),
            html.Div(id="stock-info")
        ], width=6),

        dbc.Col([
            html.H4("Tin tức thị trường", className="text-center"),
            html.Div(id="market-news")
        ], width=6)
    ])
], fluid=True)
2. Tạo callback cho biểu đồ chính
from dash.dependencies import Input, Output
import plotly.graph_objects as go
from plotly.subplots import make_subplots

@app.callback(
    Output("main-chart", "figure"),
    [
        Input("ticker-dropdown", "value"),
        Input("timeframe-dropdown", "value"),
        Input("chart-type-dropdown", "value"),
        Input("indicator-dropdown", "value")
    ]
)
def update_main_chart(ticker, timeframe, chart_type, indicators):
    # Lấy dữ liệu mới
    df = get_stock_data(ticker, period=timeframe)
    df = add_technical_indicators(df)

    # Tạo subplot với biểu đồ chính và biểu đồ khối lượng
    fig = make_subplots(rows=2, cols=1, shared_xaxes=True,
                        vertical_spacing=0.1, row_heights=[0.7, 0.3],
                        subplot_titles=(f"{ticker} Stock Price", "Volume"))

    # Tạo biểu đồ theo loại đã chọn
    if chart_type == "candlestick":
        fig.add_trace(
            go.Candlestick(
                x=df.index, open=df['Open'], high=df['High'],
                low=df['Low'], close=df['Close'],
                name="OHLC"
            ),
            row=1, col=1
        )
    elif chart_type == "line":
        fig.add_trace(
            go.Scatter(x=df.index, y=df['Close'], mode='lines', name="Close Price"),
            row=1, col=1
        )
    elif chart_type == "ohlc":
        fig.add_trace(
            go.Ohlc(
                x=df.index, open=df['Open'], high=df['High'],
                low=df['Low'], close=df['Close'],
                name="OHLC"
            ),
            row=1, col=1
        )

    # Thêm các chỉ báo kỹ thuật đã chọn
    if 'ma' in indicators or 'all' in indicators:
        fig.add_trace(
            go.Scatter(x=df.index, y=df['SMA20'], mode='lines', name="SMA 20", line=dict(width=1, color='blue')),
            row=1, col=1
        )
        fig.add_trace(
            go.Scatter(x=df.index, y=df['SMA50'], mode='lines', name="SMA 50", line=dict(width=1, color='orange')),
            row=1, col=1
        )
        fig.add_trace(
            go.Scatter(x=df.index, y=df['SMA200'], mode='lines', name="SMA 200", line=dict(width=1, color='red')),
            row=1, col=1
        )

    if 'bollinger' in indicators or 'all' in indicators:
        fig.add_trace(
            go.Scatter(x=df.index, y=df['BB_Upper'], mode='lines', name="BB Upper", line=dict(width=1, color='rgba(0,128,0,0.3)')),
            row=1, col=1
        )
        fig.add_trace(
            go.Scatter(x=df.index, y=df['BB_Lower'], mode='lines', name="BB Lower", line=dict(width=1, color='rgba(0,128,0,0.3)'),
                      fill='tonexty', fillcolor='rgba(0,128,0,0.1)'),
            row=1, col=1
        )

    # Thêm biểu đồ khối lượng
    fig.add_trace(
        go.Bar(x=df.index, y=df['Volume'], name="Volume", marker_color='rgba(0,0,128,0.5)'),
        row=2, col=1
    )

    # Cập nhật layout
    fig.update_layout(
        title=f"{ticker} Stock Analysis",
        xaxis_title="Ngày",
        yaxis_title="Giá ($)",
        height=800,
        hovermode='x unified',
        xaxis_rangeslider_visible=False
    )

    return fig
3. Tạo callback cho biểu đồ chỉ báo kỹ thuật
@app.callback(
    Output("technical-indicators", "figure"),
    [
        Input("ticker-dropdown", "value"),
        Input("timeframe-dropdown", "value"),
        Input("indicator-dropdown", "value")
    ]
)
def update_technical_indicators(ticker, timeframe, indicators):
    # Lấy dữ liệu mới
    df = get_stock_data(ticker, period=timeframe)
    df = add_technical_indicators(df)

    # Xác định số lượng subplot cần thiết
    num_subplots = sum([
        'rsi' in indicators or 'all' in indicators,
        'macd' in indicators or 'all' in indicators
    ])

    if num_subplots == 0:
        # Nếu không có chỉ báo nào được chọn, trả về biểu đồ trống
        fig = go.Figure()
        fig.update_layout(
            title="Không có chỉ báo kỹ thuật nào được chọn",
            height=300
        )
        return fig

    # Tạo subplots cho các chỉ báo
    fig = make_subplots(rows=num_subplots, cols=1, shared_xaxes=True,
                       vertical_spacing=0.1, subplot_titles=[])

    # Biến lưu trữ vị trí subplot hiện tại
    current_row = 1

    # Thêm RSI
    if 'rsi' in indicators or 'all' in indicators:
        fig.add_trace(
            go.Scatter(x=df.index, y=df['RSI'], mode='lines', name="RSI", line=dict(color='purple')),
            row=current_row, col=1
        )
        fig.add_hline(y=70, line_dash="dot", line_color="red", row=current_row, col=1)
        fig.add_hline(y=30, line_dash="dot", line_color="green", row=current_row, col=1)
        fig.update_yaxes(title_text="RSI", row=current_row, col=1)
        current_row += 1

    # Thêm MACD
    if 'macd' in indicators or 'all' in indicators:
        fig.add_trace(
            go.Scatter(x=df.index, y=df['MACD'], mode='lines', name="MACD", line=dict(color='blue')),
            row=current_row, col=1
        )
        fig.add_trace(
            go.Scatter(x=df.index, y=df['MACD_Signal'], mode='lines', name="Signal", line=dict(color='red')),
            row=current_row, col=1
        )
        fig.add_trace(
            go.Bar(x=df.index, y=df['MACD_Diff'], name="Histogram",
                  marker_color=np.where(df['MACD_Diff'] >= 0, 'rgba(0,128,0,0.5)', 'rgba(128,0,0,0.5)')),
            row=current_row, col=1
        )
        fig.update_yaxes(title_text="MACD", row=current_row, col=1)

    # Cập nhật layout
    fig.update_layout(
        title=f"Chỉ báo kỹ thuật - {ticker}",
        height=300 * num_subplots,
        hovermode='x unified',
        showlegend=True
    )

    return fig
4. Tạo callback cho tổng quan thị trường
@app.callback(
    Output("market-overview", "figure"),
    [Input("timeframe-dropdown", "value")]
)
def update_market_overview(timeframe):
    # Lấy dữ liệu chỉ số thị trường
    indices = ["^GSPC", "^DJI", "^IXIC", "^RUT"]  # S&P 500, Dow Jones, Nasdaq, Russell 2000
    index_names = ["S&P 500", "Dow Jones", "Nasdaq", "Russell 2000"]

    data = get_multiple_stocks(indices, period=timeframe)

    # Tính toán % thay đổi so với đầu kỳ
    fig = go.Figure()

    for ticker, name in zip(indices, index_names):
        df = data[ticker]
        normalized = df['Close'] / df['Close'].iloc[0] * 100 - 100  # Phần trăm thay đổi
        fig.add_trace(
            go.Scatter(x=df.index, y=normalized, mode='lines', name=name)
        )

    # Cập nhật layout
    fig.update_layout(
        title="Hiệu suất chỉ số thị trường (% thay đổi)",
        xaxis_title="Ngày",
        yaxis_title="% Thay đổi",
        hovermode='x unified'
    )

    return fig
5. Tạo callback cho so sánh ngành
@app.callback(
    Output("sector-comparison", "figure"),
    [Input("timeframe-dropdown", "value")]
)
def update_sector_comparison(timeframe):
    # Lấy dữ liệu ETF ngành
    sector_etfs = ["XLK", "XLF", "XLE", "XLV", "XLY", "XLP", "XLI", "XLB", "XLU", "XLRE"]
    sector_names = ["Công nghệ", "Tài chính", "Năng lượng", "Y tế", "Tiêu dùng",
                  "Hàng thiết yếu", "Công nghiệp", "Vật liệu", "Tiện ích", "Bất động sản"]

    data = get_multiple_stocks(sector_etfs, period=timeframe)

    # Tính hiệu suất cuối kỳ của từng ngành
    performance = []
    for ticker, name in zip(sector_etfs, sector_names):
        df = data[ticker]
        perf = (df['Close'].iloc[-1] / df['Close'].iloc[0] - 1) * 100  # Phần trăm thay đổi
        performance.append({"Sector": name, "Performance": perf})

    performance_df = pd.DataFrame(performance)
    performance_df = performance_df.sort_values("Performance", ascending=False)

    # Tạo biểu đồ cột
    fig = go.Figure()
    fig.add_trace(
        go.Bar(
            x=performance_df["Sector"],
            y=performance_df["Performance"],
            marker_color=np.where(performance_df["Performance"] >= 0, 'green', 'red')
        )
    )

    # Cập nhật layout
    fig.update_layout(
        title=f"Hiệu suất các ngành (% thay đổi trong {timeframe})",
        xaxis_title="Ngành",
        yaxis_title="% Thay đổi",
        hovermode='closest'
    )

    return fig
6. Tạo callback cho thông tin chi tiết
@app.callback(
    Output("stock-info", "children"),
    [Input("ticker-dropdown", "value")]
)
def update_stock_info(ticker):
    # Lấy thông tin cơ bản về cổ phiếu
    stock = yf.Ticker(ticker)
    info = stock.info

    # Các thông tin cần hiển thị
    try:
        company_name = info.get('longName', 'N/A')
        sector = info.get('sector', 'N/A')
        industry = info.get('industry', 'N/A')
        market_cap = info.get('marketCap', 'N/A')
        if market_cap != 'N/A':
            market_cap = f"${market_cap/1000000000:.2f}B"
        pe_ratio = info.get('trailingPE', 'N/A')
        dividend_yield = info.get('dividendYield', 'N/A')
        if dividend_yield != 'N/A':
            dividend_yield = f"{dividend_yield*100:.2f}%"
        fiftytwo_week_high = info.get('fiftyTwoWeekHigh', 'N/A')
        fiftytwo_week_low = info.get('fiftyTwoWeekLow', 'N/A')

        # Tạo bảng thông tin
        info_table = dbc.Table([
            html.Thead([
                html.Tr([html.Th("Thông tin", colSpan=2)])
            ]),
            html.Tbody([
                html.Tr([html.Td("Tên công ty"), html.Td(company_name)]),
                html.Tr([html.Td("Ngành"), html.Td(sector)]),
                html.Tr([html.Td("Lĩnh vực"), html.Td(industry)]),
                html.Tr([html.Td("Vốn hóa"), html.Td(market_cap)]),
                html.Tr([html.Td("P/E"), html.Td(pe_ratio)]),
                html.Tr([html.Td("Tỷ lệ cổ tức"), html.Td(dividend_yield)]),
                html.Tr([html.Td("52-tuần cao"), html.Td(fiftytwo_week_high)]),
                html.Tr([html.Td("52-tuần thấp"), html.Td(fiftytwo_week_low)]),
            ])
        ], bordered=True, hover=True, striped=True, responsive=True)

        return info_table
    except:
        return html.Div("Không thể lấy thông tin cho mã chứng khoán này")
7. Tạo callback cho tin tức thị trường
# Giả lập dữ liệu tin tức (trong thực tế bạn có thể sử dụng API tin tức)
def get_mock_news(ticker):
    """
    Lấy tin tức giả lập về mã chứng khoán
    """
    current_date = pd.Timestamp.now()

    mock_news = [
        {
            "title": f"Phân tích kỹ thuật: {ticker} có thể sẽ kiểm tra lại vùng hỗ trợ",
            "date": (current_date - pd.Timedelta(days=1)).strftime("%Y-%m-%d"),
            "source": "MarketWatch",
            "url": "#"
        },
        {
            "title": f"{ticker} công bố kết quả kinh doanh quý vượt dự báo",
            "date": (current_date - pd.Timedelta(days=3)).strftime("%Y-%m-%d"),
            "source": "Bloomberg",
            "url": "#"
        },
        {
            "title": f"Nhà phân tích nâng dự báo giá mục tiêu cho {ticker}",
            "date": (current_date - pd.Timedelta(days=5)).strftime("%Y-%m-%d"),
            "source": "CNBC",
            "url": "#"
        },
        {
            "title": f"{ticker} thông báo kế hoạch mở rộng thị trường mới",
            "date": (current_date - pd.Timedelta(days=7)).strftime("%Y-%m-%d"),
            "source": "Reuters",
            "url": "#"
        },
        {
            "title": f"Báo cáo ngành: Triển vọng cho các công ty như {ticker}",
            "date": (current_date - pd.Timedelta(days=10)).strftime("%Y-%m-%d"),
            "source": "Financial Times",
            "url": "#"
        }
    ]

    return mock_news

@app.callback(
    Output("market-news", "children"),
    [Input("ticker-dropdown", "value")]
)
def update_market_news(ticker):
    # Lấy tin tức (trong thực tế bạn sẽ sử dụng API tin tức thực)
    news = get_mock_news(ticker)

    # Tạo danh sách tin tức
    news_items = []
    for item in news:
        news_card = dbc.Card(
            dbc.CardBody([
                html.H5(item["title"], className="card-title"),
                html.P(f"{item['date']} - {item['source']}", className="card-text text-muted"),
                dbc.Button("Đọc thêm", color="primary", size="sm", href=item["url"])
            ]),
            className="mb-3"
        )
        news_items.append(news_card)

    return html.Div(news_items)
V. Thêm tính năng nâng cao
1. Chế độ giao dịch thời gian thực
import time
from datetime import datetime, timedelta
from threading import Thread

# Khởi tạo dữ liệu toàn cục và biến theo dõi
global_data = {}
is_streaming = False

def stream_market_data(ticker, interval=60):
    """
    Cập nhật dữ liệu thị trường trong thời gian thực
    """
    global global_data, is_streaming
    is_streaming = True

    while is_streaming:
        # Kiểm tra xem thị trường có mở cửa không
        now = datetime.now()
        market_open = now.replace(hour=9, minute=30, second=0, microsecond=0)
        market_close = now.replace(hour=16, minute=0, second=0, microsecond=0)

        # Chỉ cập nhật khi thị trường mở cửa (giờ New York)
        if market_open <= now <= market_close and now.weekday() < 5:
            # Lấy dữ liệu mới nhất
            end_time = now
            start_time = end_time - timedelta(days=1)
            try:
                data = yf.download(ticker, start=start_time, end=end_time, interval="1m")
                if not data.empty:
                    global_data[ticker] = data
                    print(f"Đã cập nhật dữ liệu cho {ticker} lúc {now}")
            except Exception as e:
                print(f"Lỗi khi cập nhật dữ liệu: {e}")

        # Chờ đến lần cập nhật tiếp theo
        time.sleep(interval)

# Thêm nút điều khiển chế độ thời gian thực
real_time_controls = dbc.Row([
    dbc.Col([
        dbc.Button("Bắt đầu theo dõi thời gian thực", id="start-streaming-button", color="success", className="mr-2"),
        dbc.Button("Dừng theo dõi", id="stop-streaming-button", color="danger", className="mr-2"),
        html.Span(id="streaming-status")
    ], width=12)
], className="mb-4")

# Thêm vào layout
app.layout.children.insert(3, real_time_controls)

# Thêm callbacks
@app.callback(
    Output("streaming-status", "children"),
    [
        Input("start-streaming-button", "n_clicks"),
        Input("stop-streaming-button", "n_clicks")
    ],
    prevent_initial_call=True
)
def toggle_streaming(start_clicks, stop_clicks):
    global is_streaming
    ctx = dash.callback_context

    if not ctx.triggered:
        return "Không theo dõi thời gian thực"

    button_id = ctx.triggered[0]['prop_id'].split('.')[0]

    if button_id == "start-streaming-button":
        if not is_streaming:
            ticker = "AAPL"  # Mã mặc định hoặc lấy từ dropdown
            thread = Thread(target=stream_market_data, args=(ticker,))
            thread.daemon = True
            thread.start()
        return "Đang theo dõi thời gian thực..."
    elif button_id == "stop-streaming-button":
        is_streaming = False
        return "Đã dừng theo dõi"
2. Cảnh báo kỹ thuật
def generate_technical_alerts(df, ticker):
    """
    Tạo cảnh báo dựa trên các chỉ báo kỹ thuật
    """
    alerts = []
    latest = df.iloc[-1]
    prev = df.iloc[-2]

    # Kiểm tra MA Cross
    if prev['SMA20'] <= prev['SMA50'] and latest['SMA20'] > latest['SMA50']:
        alerts.append({
            "type": "Golden Cross",
            "message": f"Golden Cross cho {ticker} - MA20 đã cắt lên trên MA50",
            "severity": "positive"
        })

    if prev['SMA20'] >= prev['SMA50'] and latest['SMA20'] < latest['SMA50']:
        alerts.append({
            "type": "Death Cross",
            "message": f"Death Cross cho {ticker} - MA20 đã cắt xuống dưới MA50",
            "severity": "negative"
        })

    # Kiểm tra RSI
    if latest['RSI'] < 30:
        alerts.append({
            "type": "RSI Oversold",
            "message": f"RSI cho {ticker} trong vùng quá bán ({latest['RSI']:.2f})",
            "severity": "positive"
        })

    if latest['RSI'] > 70:
        alerts.append({
            "type": "RSI Overbought",
            "message": f"RSI cho {ticker} trong vùng quá mua ({latest['RSI']:.2f})",
            "severity": "negative"
        })

    # Kiểm tra MACD
    if prev['MACD'] <= prev['MACD_Signal'] and latest['MACD'] > latest['MACD_Signal']:
        alerts.append({
            "type": "MACD Cross",
            "message": f"MACD cho {ticker} đã cắt lên trên đường Signal",
            "severity": "positive"
        })

    if prev['MACD'] >= prev['MACD_Signal'] and latest['MACD'] < latest['MACD_Signal']:
        alerts.append({
            "type": "MACD Cross",
            "message": f"MACD cho {ticker} đã cắt xuống dưới đường Signal",
            "severity": "negative"
        })

    # Kiểm tra Bollinger Bands
    if latest['Close'] < latest['BB_Lower']:
        alerts.append({
            "type": "Bollinger Bands",
            "message": f"Giá {ticker} đang ở dưới dải dưới Bollinger Bands",
            "severity": "positive"
        })

    if latest['Close'] > latest['BB_Upper']:
        alerts.append({
            "type": "Bollinger Bands",
            "message": f"Giá {ticker} đang ở trên dải trên Bollinger Bands",
            "severity": "negative"
        })

    return alerts

# Thêm phần cảnh báo vào layout
alerts_section = dbc.Row([
    dbc.Col([
        html.H4("Cảnh báo kỹ thuật", className="text-center"),
        html.Div(id="technical-alerts")
    ], width=12)
], className="mb-4")

app.layout.children.insert(5, alerts_section)

# Thêm callback
@app.callback(
    Output("technical-alerts", "children"),
    [
        Input("ticker-dropdown", "value"),
        Input("timeframe-dropdown", "value"),
    ]
)
def update_alerts(ticker, timeframe):
    # Lấy dữ liệu
    df = get_stock_data(ticker, period=timeframe)
    df = add_technical_indicators(df)

    # Tạo cảnh báo
    alerts = generate_technical_alerts(df, ticker)

    if not alerts:
        return html.Div("Không có cảnh báo kỹ thuật nào", className="text-center")

    # Tạo danh sách cảnh báo
    alert_items = []
    for alert in alerts:
        color = "success" if alert["severity"] == "positive" else "danger"
        alert_card = dbc.Alert(
            [
                html.H5(alert["type"], className="alert-heading"),
                html.P(alert["message"])
            ],
            color=color,
            className="mb-2"
        )
        alert_items.append(alert_card)

    return html.Div(alert_items)
3. Chức năng sàng lọc cổ phiếu
# Thêm tab sàng lọc cổ phiếu
screener_tab = dbc.Tab([
    dbc.Row([
        dbc.Col([
            html.H4("Thiết lập tiêu chí sàng lọc", className="mb-4"),

            # Tiêu chí về giá
            html.H5("Giá"),
            dbc.Row([
                dbc.Col(
                    dbc.Input(id="min-price", type="number", placeholder="Giá tối thiểu ($)")
                ),
                dbc.Col(
                    dbc.Input(id="max-price", type="number", placeholder="Giá tối đa ($)")
                )
            ], className="mb-3"),

            # Tiêu chí về vốn hóa
            html.H5("Vốn hóa thị trường"),
            dcc.Dropdown(
                id="market-cap-filter",
                options=[
                    {"label": "Mega (>$200B)", "value": "mega"},
                    {"label": "Large ($10B-$200B)", "value": "large"},
                    {"label": "Mid ($2B-$10B)", "value": "mid"},
                    {"label": "Small ($300M-$2B)", "value": "small"},
                    {"label": "Micro (<$300M)", "value": "micro"}
                ],
                multi=True
            ),

            # Tiêu chí về ngành
            html.H5("Ngành", className="mt-3"),
            dcc.Dropdown(
                id="sector-filter",
                options=[
                    {"label": "Công nghệ", "value": "Technology"},
                    {"label": "Tài chính", "value": "Financial"},
                    {"label": "Y tế", "value": "Healthcare"},
                    {"label": "Tiêu dùng", "value": "Consumer Cyclical"},
                    {"label": "Bất động sản", "value": "Real Estate"},
                    {"label": "Năng lượng", "value": "Energy"},
                    {"label": "Vật liệu", "value": "Basic Materials"}
                ],
                multi=True
            ),

            # Tiêu chí về chỉ báo kỹ thuật
            html.H5("Chỉ báo kỹ thuật", className="mt-3"),
            dcc.Checklist(
                id="technical-filter",
                options=[
                    {"label": "Giá trên MA200", "value": "price_above_ma200"},
                    {"label": "Giá dưới MA200", "value": "price_below_ma200"},
                    {"label": "Golden Cross (MA50 > MA200)", "value": "golden_cross"},
                    {"label": "Death Cross (MA50 < MA200)", "value": "death_cross"},
                    {"label": "RSI < 30 (Quá bán)", "value": "rsi_oversold"},
                    {"label": "RSI > 70 (Quá mua)", "value": "rsi_overbought"}
                ],
                value=[]
            ),

            # Nút sàng lọc
            dbc.Button("Sàng lọc", id="run-screener", color="primary", className="mt-4")
        ], width=4),

        dbc.Col([
            html.H4("Kết quả sàng lọc", className="mb-4"),
            html.Div(id="screener-results")
        ], width=8)
    ])
], label="Sàng lọc cổ phiếu")

# Thêm tab vào layout
app.layout = dbc.Container([
    # Header
    dbc.Row([
        dbc.Col(html.H1("Bảng điều khiển theo dõi thị trường", className="text-center p-4"), width=12)
    ]),

    # Tabs
    dbc.Tabs([
        dbc.Tab([
            # Nội dung tab Dashboard hiện tại
            # (Đặt phần thân của layout hiện tại vào đây)
        ], label="Dashboard"),

        screener_tab
    ])
])

# Callback cho sàng lọc cổ phiếu
@app.callback(
    Output("screener-results", "children"),
    [Input("run-screener", "n_clicks")],
    [
        State("min-price", "value"),
        State("max-price", "value"),
        State("market-cap-filter", "value"),
        State("sector-filter", "value"),
        State("technical-filter", "value")
    ],
    prevent_initial_call=True
)
def run_stock_screener(n_clicks, min_price, max_price, market_caps, sectors, technical):
    if n_clicks is None:
        return html.Div("Chọn các tiêu chí và nhấn 'Sàng lọc' để xem kết quả")

    # Danh sách các cổ phiếu để sàng lọc (trong thực tế sẽ rộng hơn nhiều)
    all_stocks = ["AAPL", "MSFT", "GOOGL", "AMZN", "META", "TSLA", "JPM", "V", "JNJ", "PG",
                 "HD", "MA", "UNH", "BAC", "NVDA", "DIS", "ADBE", "CRM", "NFLX", "INTC"]

    # Giả lập kết quả sàng lọc (trong thực tế sẽ lấy dữ liệu thực và áp dụng các bộ lọc)
    filtered_stocks = []
    for ticker in all_stocks:
        # Trong thực tế, đây là nơi áp dụng các bộ lọc dựa trên tiêu chí
        # Ở đây chúng ta giả lập kết quả
        stock = yf.Ticker(ticker)
        try:
            info = stock.info
            current_price = info.get('currentPrice', 0)
            market_cap = info.get('marketCap', 0)
            sector = info.get('sector', 'Unknown')

            # Áp dụng bộ lọc giá
            if min_price and current_price < min_price:
                continue
            if max_price and current_price > max_price:
                continue

            # Áp dụng bộ lọc vốn hóa
            if market_caps:
                market_cap_cat = ""
                if market_cap > 200e9:
                    market_cap_cat = "mega"
                elif market_cap > 10e9:
                    market_cap_cat = "large"
                elif market_cap > 2e9:
                    market_cap_cat = "mid"
                elif market_cap > 300e6:
                    market_cap_cat = "small"
                else:
                    market_cap_cat = "micro"

                if market_cap_cat not in market_caps:
                    continue

            # Áp dụng bộ lọc ngành
            if sectors and sector not in sectors:
                continue

            # Áp dụng bộ lọc kỹ thuật (giả lập)
            if 'price_above_ma200' in technical:
                # Trong thực tế, kiểm tra giá có cao hơn MA200 không
                pass

            # Nếu vượt qua tất cả các bộ lọc, thêm vào danh sách kết quả
            filtered_stocks.append({
                "ticker": ticker,
                "name": info.get('longName', 'N/A'),
                "price": current_price,
                "change": info.get('regularMarketChangePercent', 0) * 100,
                "market_cap": market_cap / 1e9,  # Convert to billions
                "sector": sector
            })
        except:
            continue

    # Tạo bảng kết quả
    if not filtered_stocks:
        return html.Div("Không tìm thấy cổ phiếu nào phù hợp với tiêu chí", className="text-center mt-4")

    # Tạo DataFrame từ kết quả
    results_df = pd.DataFrame(filtered_stocks)

    # Tạo bảng hiển thị
    table_header = [
        html.Thead(html.Tr([
            html.Th("Mã"), html.Th("Tên công ty"), html.Th("Giá ($)"),
            html.Th("Thay đổi (%)"), html.Th("Vốn hóa ($B)"), html.Th("Ngành")
        ]))
    ]

    table_rows = []
    for i, row in results_df.iterrows():
        change_color = "text-success" if row["change"] >= 0 else "text-danger"
        change_text = f"{row['change']:.2f}%" if not pd.isna(row["change"]) else "N/A"

        table_rows.append(html.Tr([
            html.Td(row["ticker"]),
            html.Td(row["name"]),
            html.Td(f"${row['price']:.2f}" if not pd.isna(row["price"]) else "N/A"),
            html.Td(change_text, className=change_color),
            html.Td(f"${row['market_cap']:.2f}B" if not pd.isna(row["market_cap"]) else "N/A"),
            html.Td(row["sector"])
        ]))

    table_body = [html.Tbody(table_rows)]

    return dbc.Table(table_header + table_body, bordered=True, hover=True, striped=True, responsive=True)
4. Thiết kế chức năng so sánh nhiều mã cổ phiếu
# Tạo tab so sánh cổ phiếu
comparison_tab = dbc.Tab([
    dbc.Row([
        dbc.Col([
            html.H4("Chọn cổ phiếu để so sánh", className="mb-3"),
            dcc.Dropdown(
                id="comparison-tickers",
                options=[{"label": ticker, "value": ticker} for ticker in tech_tickers + ["NFLX", "TSLA", "IBM", "INTC", "AMD"]],
                value=["AAPL", "MSFT", "GOOGL"],
                multi=True
            ),

            html.H5("Thông số so sánh", className="mt-4 mb-3"),
            dcc.Checklist(
                id="comparison-metrics",
                options=[
                    {"label": "Giá tương đối", "value": "relative_price"},
                    {"label": "Khối lượng giao dịch", "value": "volume"},
                    {"label": "Biến động", "value": "volatility"},
                    {"label": "RSI", "value": "rsi"},
                ],
                value=["relative_price"]
            ),

            html.H5("Khoảng thời gian", className="mt-4 mb-3"),
            dcc.Dropdown(
                id="comparison-timeframe",
                options=[
                    {"label": "1 tháng", "value": "1mo"},
                    {"label": "3 tháng", "value": "3mo"},
                    {"label": "6 tháng", "value": "6mo"},
                    {"label": "1 năm", "value": "1y"},
                    {"label": "2 năm", "value": "2y"},
                    {"label": "5 năm", "value": "5y"},
                ],
                value="1y"
            ),

            dbc.Button("So sánh", id="run-comparison", color="primary", className="mt-4")
        ], width=3),

        dbc.Col([
            html.Div(id="comparison-charts")
        ], width=9)
    ])
], label="So sánh cổ phiếu")

# Thêm tab vào tabs
# (Cập nhật lại phần layout để thêm tab này vào)

# Callback cho phần so sánh
@app.callback(
    Output("comparison-charts", "children"),
    [Input("run-comparison", "n_clicks")],
    [
        State("comparison-tickers", "value"),
        State("comparison-metrics", "value"),
        State("comparison-timeframe", "value")
    ],
    prevent_initial_call=True
)
def update_comparison_charts(n_clicks, tickers, metrics, timeframe):
    if n_clicks is None or not tickers:
        return html.Div("Chọn ít nhất một mã cổ phiếu và nhấn 'So sánh' để xem kết quả")

    # Lấy dữ liệu cho các mã đã chọn
    data = get_multiple_stocks(tickers, period=timeframe)

    # Tạo danh sách biểu đồ
    charts = []

    # Biểu đồ giá tương đối
    if "relative_price" in metrics:
        fig = go.Figure()

        for ticker in tickers:
            df = data[ticker]
            normalized = df['Close'] / df['Close'].iloc[0] * 100
            fig.add_trace(
                go.Scatter(x=df.index, y=normalized, mode='lines', name=ticker)
            )

        fig.update_layout(
            title="So sánh giá tương đối (điểm cơ sở = 100)",
            xaxis_title="Ngày",
            yaxis_title="Giá tương đối",
            hovermode='x unified'
        )

        charts.append(dcc.Graph(figure=fig))

    # Biểu đồ khối lượng giao dịch
    if "volume" in metrics:
        fig = go.Figure()

        for ticker in tickers:
            df = data[ticker]
            # Chuẩn hóa khối lượng để dễ so sánh
            volume_avg = df['Volume'].mean()
            normalized_volume = (df['Volume'] / volume_avg) * 100

            fig.add_trace(
                go.Scatter(x=df.index, y=normalized_volume, mode='lines', name=f"{ticker} (Avg={volume_avg/1e6:.1f}M)")
            )

        fig.update_layout(
            title="So sánh khối lượng giao dịch tương đối (% của trung bình)",
            xaxis_title="Ngày",
            yaxis_title="Khối lượng tương đối (%)",
            hovermode='x unified'
        )

        charts.append(dcc.Graph(figure=fig))

    # Biểu đồ biến động
    if "volatility" in metrics:
        fig = go.Figure()

        for ticker in tickers:
            df = data[ticker]
            # Tính biến động 20 ngày (độ lệch chuẩn của lợi nhuận)
            df['Returns'] = df['Close'].pct_change()
            volatility = df['Returns'].rolling(window=20).std() * np.sqrt(252) * 100  # Annualized volatility

            fig.add_trace(
                go.Scatter(x=df.index, y=volatility, mode='lines', name=ticker)
            )

        fig.update_layout(
            title="So sánh biến động giá (% biến động hàng năm, cửa sổ 20 ngày)",
            xaxis_title="Ngày",
            yaxis_title="Biến động (%)",
            hovermode='x unified'
        )

        charts.append(dcc.Graph(figure=fig))

    # Biểu đồ RSI
    if "rsi" in metrics:
        fig = go.Figure()

        for ticker in tickers:
            df = data[ticker]
            # Tính RSI
            df_with_indicators = add_technical_indicators(df)

            fig.add_trace(
                go.Scatter(x=df.index, y=df_with_indicators['RSI'], mode='lines', name=ticker)
            )

        # Thêm vùng quá mua/quá bán
        fig.add_hrect(y0=70, y1=100, line_width=0, fillcolor="red", opacity=0.2)
        fig.add_hrect(y0=0, y1=30, line_width=0, fillcolor="green", opacity=0.2)

        fig.update_layout(
            title="So sánh chỉ báo RSI",
            xaxis_title="Ngày",
            yaxis_title="RSI (14)",
            hovermode='x unified',
            yaxis=dict(range=[0, 100])
        )

        charts.append(dcc.Graph(figure=fig))

    # Bảng so sánh các chỉ số cơ bản
    # Lấy thông tin cơ bản về các cổ phiếu để so sánh
    stock_info = []
    for ticker in tickers:
        try:
            stock = yf.Ticker(ticker)
            info = stock.info

            stock_info.append({
                "Ticker": ticker,
                "Tên": info.get('shortName', 'N/A'),
                "Giá hiện tại": info.get('currentPrice', 'N/A'),
                "Thay đổi (%)": info.get('regularMarketChangePercent', 'N/A') * 100 if info.get('regularMarketChangePercent') else 'N/A',
                "P/E": info.get('trailingPE', 'N/A'),
                "EPS": info.get('trailingEps', 'N/A'),
                "Vốn hóa ($B)": info.get('marketCap', 'N/A') / 1e9 if info.get('marketCap') else 'N/A',
                "Tỷ lệ cổ tức (%)": info.get('dividendYield', 'N/A') * 100 if info.get('dividendYield') else 'N/A'
            })
        except:
            stock_info.append({
                "Ticker": ticker,
                "Tên": "N/A",
                "Giá hiện tại": "N/A",
                "Thay đổi (%)": "N/A",
                "P/E": "N/A",
                "EPS": "N/A",
                "Vốn hóa ($B)": "N/A",
                "Tỷ lệ cổ tức (%)": "N/A"
            })

    # Tạo DataFrame từ thông tin đã thu thập
    info_df = pd.DataFrame(stock_info)

    # Tạo bảng so sánh
    table_header = [
        html.Thead(html.Tr([html.Th(col) for col in info_df.columns]))
    ]

    table_rows = []
    for i, row in info_df.iterrows():
        cells = []
        for col in info_df.columns:
            value = row[col]
            # Định dạng giá trị
            if isinstance(value, (float, int)) and col not in ["Ticker"]:
                if col in ["Thay đổi (%)", "Tỷ lệ cổ tức (%)"]:
                    formatted = f"{value:.2f}%" if value != 'N/A' else 'N/A'
                    color_class = "text-success" if value > 0 else "text-danger" if value < 0 else ""
                    cells.append(html.Td(formatted, className=color_class))
                elif col == "Vốn hóa ($B)":
                    formatted = f"${value:.2f}B" if value != 'N/A' else 'N/A'
                    cells.append(html.Td(formatted))
                elif col in ["Giá hiện tại", "EPS"]:
                    formatted = f"${value:.2f}" if value != 'N/A' else 'N/A'
                    cells.append(html.Td(formatted))
                else:
                    formatted = f"{value:.2f}" if value != 'N/A' else 'N/A'
                    cells.append(html.Td(formatted))
            else:
                cells.append(html.Td(value))

        table_rows.append(html.Tr(cells))

    table_body = [html.Tbody(table_rows)]
    comparison_table = dbc.Table(
        table_header + table_body,
        bordered=True,
        hover=True,
        striped=True,
        responsive=True,
        className="mt-4"
    )

    return html.Div(charts + [html.H4("So sánh chỉ số cơ bản", className="mt-4 mb-3"), comparison_table])
VI. Triển khai và tối ưu hóa ứng dụng
1. Chạy ứng dụng
if __name__ == '__main__':
    app.run_server(debug=True, host='0.0.0.0', port=5000)
2. Tối ưu hóa hiệu suất
Một bảng điều khiển thị trường cần xử lý lượng lớn dữ liệu và yêu cầu phản hồi nhanh. Dưới đây là một số kỹ thuật tối ưu hóa:
# 1. Lưu bộ nhớ đệm dữ liệu
import diskcache as dc
from flask_caching import Cache

cache = dc.Cache('./cache')
server = app.server
flask_cache = Cache(server, config={
    'CACHE_TYPE': 'filesystem',
    'CACHE_DIR': 'flask_cache',
    'CACHE_DEFAULT_TIMEOUT': 300
})

@flask_cache.memoize(timeout=300)  # Cache trong 5 phút
def cached_get_stock_data(ticker, period, interval):
    return get_stock_data(ticker, period, interval)

# Sử dụng hàm đã lưu đệm thay vì gọi API trực tiếp
@app.callback(...)
def update_main_chart(ticker, timeframe, chart_type, indicators):
    df = cached_get_stock_data(ticker, period=timeframe, interval='1d')
    # ...tiếp tục callback
3. Xử lý lỗi và cải thiện trải nghiệm người dùng
# Tạo callback để hiển thị thông báo lỗi
@app.callback(
    Output("error-message", "children"),
    Output("error-message", "is_open"),
    [Input("main-chart", "figure")],
    prevent_initial_call=True
)
def handle_errors(figure):
    if 'data' not in figure or not figure['data']:
        return "Lỗi khi tải dữ liệu. Vui lòng thử lại sau.", True
    return "", False

# Thêm thành phần thông báo lỗi vào layout
error_message = dbc.Modal(
    [
        dbc.ModalHeader("Lỗi"),
        dbc.ModalBody(id="error-message"),
        dbc.ModalFooter(dbc.Button("Đóng", id="close-error", className="ml-auto"))
    ],
    id="error-modal",
    is_open=False
)

app.layout.children.append(error_message)

# Callback để đóng thông báo lỗi
@app.callback(
    Output("error-modal", "is_open"),
    [Input("close-error", "n_clicks")],
    [State("error-modal", "is_open")],
    prevent_initial_call=True
)
def close_error_modal(n_clicks, is_open):
    if n_clicks:
        return False
    return is_open
4. Bảo mật và xác thực người dùng (cho ứng dụng có yêu cầu đăng nhập)
# Tạo layout đăng nhập
login_layout = dbc.Container([
    dbc.Row([
        dbc.Col([
            html.H2("Đăng nhập", className="text-center mb-4"),
            dbc.Card([
                dbc.CardBody([
                    dbc.Input(id="username-input", placeholder="Tên đăng nhập", type="text", className="mb-3"),
                    dbc.Input(id="password-input", placeholder="Mật khẩu", type="password", className="mb-3"),
                    dbc.Button("Đăng nhập", id="login-button", color="primary", className="w-100"),
                    html.Div(id="login-error", className="text-danger mt-3")
                ])
            ])
        ], width={"size": 6, "offset": 3})
    ], className="vh-100 d-flex align-items-center")
])

# Hàm kiểm tra đăng nhập (thực tế sẽ sử dụng cơ sở dữ liệu và mã hóa)
def check_credentials(username, password):
    valid_credentials = {
        "user1": "password1",
        "user2": "password2",
        "admin": "admin123"
    }
    return username in valid_credentials and valid_credentials[username] == password

# Tạo callback đăng nhập
@app.callback(
    Output("url", "pathname"),
    Output("login-error", "children"),
    [Input("login-button", "n_clicks")],
    [State("username-input", "value"), State("password-input", "value")],
    prevent_initial_call=True
)
def process_login(n_clicks, username, password):
    if n_clicks is None:
        return no_update, ""

    if not username or not password:
        return no_update, "Vui lòng nhập đầy đủ thông tin đăng nhập"

    if check_credentials(username, password):
        return "/dashboard", ""
    else:
        return no_update, "Tên đăng nhập hoặc mật khẩu không chính xác"

# Cập nhật layout chính của ứng dụng để hỗ trợ định tuyến
app.layout = html.Div([
    dcc.Location(id="url", refresh=False),
    html.Div(id="page-content")
])

@app.callback(
    Output("page-content", "children"),
    [Input("url", "pathname")]
)
def display_page(pathname):
    if pathname == "/login" or pathname == "/":
        return login_layout
    elif pathname == "/dashboard":
        return main_layout  # Layout chính của ứng dụng
    else:
        return "404 - Trang không tồn tại"
VII. Mở rộng và cải tiến bảng điều khiển
1. Thêm tính năng dự đoán giá sử dụng Machine Learning
from sklearn.preprocessing import MinMaxScaler
from sklearn.linear_model import LinearRegression
from sklearn.ensemble import RandomForestRegressor
import tensorflow as tf
from tensorflow.keras.models import Sequential
from tensorflow.keras.layers import Dense, LSTM, Dropout

def predict_price_movement(ticker, prediction_days=30):
    """
    Dự đoán giá cổ phiếu trong tương lai sử dụng mô hình ML đơn giản
    """
    # Lấy dữ liệu
    df = get_stock_data(ticker, period="2y")

    # Chuẩn bị dữ liệu
    data = df['Close'].values.reshape(-1, 1)
    scaler = MinMaxScaler()
    scaled_data = scaler.fit_transform(data)

    # Tạo chuỗi dữ liệu (X: 60 ngày trước, y: ngày tiếp theo)
    X, y = [], []
    for i in range(60, len(scaled_data)):
        X.append(scaled_data[i-60:i, 0])
        y.append(scaled_data[i, 0])
    X, y = np.array(X), np.array(y)

    # Chia tập huấn luyện và kiểm thử
    split = int(0.8 * len(X))
    X_train, X_test = X[:split], X[split:]
    y_train, y_test = y[:split], y[split:]

    # Định hình dữ liệu cho LSTM
    X_train = np.reshape(X_train, (X_train.shape[0], X_train.shape[1], 1))
    X_test = np.reshape(X_test, (X_test.shape[0], X_test.shape[1], 1))

    # Xây dựng mô hình LSTM
    model = Sequential()
    model.add(LSTM(units=50, return_sequences=True, input_shape=(X_train.shape[1], 1)))
    model.add(Dropout(0.2))
    model.add(LSTM(units=50, return_sequences=False))
    model.add(Dropout(0.2))
    model.add(Dense(units=1))

    model.compile(optimizer='adam', loss='mean_squared_error')
    model.fit(X_train, y_train, epochs=25, batch_size=32, verbose=0)

    # Dự đoán
    test_prediction = model.predict(X_test)
    test_prediction = scaler.inverse_transform(test_prediction)
    real_values = scaler.inverse_transform(y_test.reshape(-1, 1))

    # Đánh giá mô hình
    mse = np.mean((test_prediction - real_values)**2)
    rmse = np.sqrt(mse)

    # Dự đoán cho tương lai
    future_data = scaled_data[-60:].reshape(1, 60, 1)
    future_predictions = []

    for _ in range(prediction_days):
        prediction = model.predict(future_data)[0][0]
        future_predictions.append(prediction)
        future_data = np.append(future_data[:,1:,:], [[prediction]], axis=1)

    # Chuyển đổi về giá thực
    future_predictions = scaler.inverse_transform(np.array(future_predictions).reshape(-1, 1)).flatten()

    # Tạo dữ liệu ngày trong tương lai
    last_date = df.index[-1]
    future_dates = pd.date_range(start=last_date + pd.Timedelta(days=1), periods=prediction_days, freq='B')

    return {
        'model_performance': {
            'rmse': rmse,
            'mse': mse
        },
        'test_prediction': test_prediction.flatten(),
        'real_values': real_values.flatten(),
        'future_dates': future_dates,
        'future_predictions': future_predictions,
        'last_price': df['Close'].iloc[-1]
    }

# Thêm tab dự đoán
prediction_tab = dbc.Tab([
    dbc.Row([
        dbc.Col([
            html.H4("Thiết lập dự đoán", className="mb-4"),

            dcc.Dropdown(
                id="prediction-ticker",
                options=[{"label": ticker, "value": ticker} for ticker in tech_tickers],
                value="AAPL",
                placeholder="Chọn mã chứng khoán"
            ),

            html.H5("Khoảng thời gian dự đoán", className="mt-3"),
            dcc.Slider(
                id="prediction-days",
                min=5,
                max=60,
                step=5,
                value=30,
                marks={i: f"{i}" for i in range(5, 61, 5)}
            ),

            dbc.Button("Bắt đầu dự đoán", id="run-prediction", color="primary", className="mt-4")
        ], width=3),

        dbc.Col([
            dcc.Loading(
                id="prediction-loading",
                type="circle",
                children=[html.Div(id="prediction-results")]
            )
        ], width=9)
    ])
], label="Dự đoán giá")

# Thêm tab vào tabs
# (Cập nhật phần layout để thêm tab này)

# Callback cho dự đoán
@app.callback(
    Output("prediction-results", "children"),
    [Input("run-prediction", "n_clicks")],
    [State("prediction-ticker", "value"), State("prediction-days", "value")],
    prevent_initial_call=True
)
def display_prediction(n_clicks, ticker, days):
    if n_clicks is None:
        return html.Div("Chọn cài đặt và nhấn 'Bắt đầu dự đoán'")

    try:
        # Thực hiện dự đoán
        prediction = predict_price_movement(ticker, prediction_days=days)

        # Tạo biểu đồ kết quả
        results = []

        # Biểu đồ dự đoán
        fig = go.Figure()

        # Lấy dữ liệu quá khứ
        df = get_stock_data(ticker, period="2y")

        # Vẽ giá quá khứ
        fig.add_trace(
            go.Scatter(x=df.index, y=df['Close'], mode='lines', name="Giá quá khứ", line=dict(color='blue'))
        )

        # Vẽ dự đoán tương lai
        fig.add_trace(
            go.Scatter(
                x=prediction['future_dates'],
                y=prediction['future_predictions'],
                mode='lines',
                name="Dự đoán",
                line=dict(color='red', dash='dash')
            )
        )

        # Thêm vùng tin cậy (đơn giản: ±10%)
        upper_bound = prediction['future_predictions'] * 1.1
        lower_bound = prediction['future_predictions'] * 0.9

        fig.add_trace(
            go.Scatter(
                x=prediction['future_dates'],
                y=upper_bound,
                mode='lines',
                line=dict(width=0),
                showlegend=False
            )
        )

        fig.add_trace(
            go.Scatter(
                x=prediction['future_dates'],
                y=lower_bound,
                mode='lines',
                line=dict(width=0),
                fill='tonexty',
                fillcolor='rgba(255, 0, 0, 0.1)',
                name="Khoảng tin cậy"
            )
        )

        fig.update_layout(
            title=f"Dự đoán giá {ticker} - {days} ngày tiếp theo",
            xaxis_title="Ngày",
            yaxis_title="Giá ($)",
            hovermode='x unified'
        )

        results.append(dcc.Graph(figure=fig))

        # Thêm thông tin về hiệu suất mô hình
        performance_info = [
            html.H5("Hiệu suất mô hình", className="mt-4"),
            html.P(f"Root Mean Squared Error (RMSE): ${prediction['model_performance']['rmse']:.2f}"),
            html.P(f"Giá hiện tại: ${prediction['last_price']:.2f}"),
            html.P(f"Giá dự đoán sau {days} ngày: ${prediction['future_predictions'][-1]:.2f}"),
            html.P(f"Thay đổi dự kiến: {((prediction['future_predictions'][-1] / prediction['last_price']) - 1) * 100:.2f}%")
        ]

        results.append(html.Div(performance_info))

        # Thêm cảnh báo
        alert = dbc.Alert(
            "Lưu ý: Dự đoán này chỉ mang tính chất tham khảo và có thể không chính xác. "
            "Không nên sử dụng làm cơ sở duy nhất cho quyết định đầu tư.",
            color="warning",
            className="mt-4"
        )

        results.append(alert)

        return html.Div(results)
    except Exception as e:
        return html.Div([
            html.H5("Lỗi khi thực hiện dự đoán", className="text-danger"),
            html.P(str(e))
        ])
2. Thêm tính năng thông báo qua email hoặc tin nhắn
# Thêm tab thông báo và cảnh báo
alerts_tab = dbc.Tab([
    dbc.Row([
        dbc.Col([
            html.H4("Thiết lập cảnh báo", className="mb-4"),

            html.H5("Chọn mã chứng khoán"),
            dcc.Dropdown(
                id="alert-ticker",
                options=[{"label": ticker, "value": ticker} for ticker in tech_tickers],
                placeholder="Chọn mã chứng khoán",
                value="AAPL"
            ),

            html.H5("Loại cảnh báo", className="mt-3"),
            dcc.RadioItems(
                id="alert-type",
                options=[
                    {"label": "Cảnh báo giá", "value": "price"},
                    {"label": "Cảnh báo % thay đổi", "value": "percent"},
                    {"label": "Cảnh báo chỉ báo kỹ thuật", "value": "technical"}
                ],
                value="price"
            ),

            # Điều kiện dựa vào loại cảnh báo
            html.Div(id="alert-condition-container", className="mt-3"),

            html.H5("Phương thức nhận thông báo", className="mt-3"),
            dcc.Checklist(
                id="alert-method",
                options=[
                    {"label": "Email", "value": "email"},
                    {"label": "Thông báo trên ứng dụng", "value": "app"}
                ],
                value=["app"]
            ),

            # Tùy chọn email nếu được chọn
            html.Div(id="email-options-container"),

            dbc.Button("Tạo cảnh báo", id="create-alert", color="primary", className="mt-4")
        ], width=4),

        dbc.Col([
            html.H4("Cảnh báo của bạn", className="mb-4"),
            html.Div(id="active-alerts")
        ], width=8)
    ])
], label="Thông báo & Cảnh báo")

# Callback để thay đổi điều kiện cảnh báo dựa vào loại cảnh báo
@app.callback(
    Output("alert-condition-container", "children"),
    [Input("alert-type", "value"), Input("alert-ticker", "value")]
)
def update_alert_condition(alert_type, ticker):
    # Lấy dữ liệu hiện tại để hiển thị điểm tham chiếu
    try:
        current_data = yf.Ticker(ticker).history(period="1d")
        current_price = current_data['Close'].iloc[-1]
    except:
        current_price = 100  # Giá mặc định nếu không lấy được

    if alert_type == "price":
        return html.Div([
            html.H5(f"Giá hiện tại: ${current_price:.2f}"),
            dbc.Row([
                dbc.Col([
                    html.Label("Điều kiện"),
                    dcc.Dropdown(
                        id="price-condition",
                        options=[
                            {"label": "Cao hơn hoặc bằng", "value": ">="},
                            {"label": "Thấp hơn hoặc bằng", "value": "<="}
                        ],
                        value=">="
                    )
                ], width=6),
                dbc.Col([
                    html.Label("Giá mục tiêu ($)"),
                    dbc.Input(
                        id="price-target",
                        type="number",
                        value=round(current_price * 1.05, 2)  # Mặc định +5%
                    )
                ], width=6)
            ])
        ])

    elif alert_type == "percent":
        return html.Div([
            dbc.Row([
                dbc.Col([
                    html.Label("Điều kiện"),
                    dcc.Dropdown(
                        id="percent-condition",
                        options=[
                            {"label": "Tăng hơn", "value": "increase"},
                            {"label": "Giảm hơn", "value": "decrease"}
                        ],
                        value="increase"
                    )
                ], width=6),
                dbc.Col([
                    html.Label("Phần trăm (%)"),
                    dbc.Input(
                        id="percent-target",
                        type="number",
                        value=5  # Mặc định 5%
                    )
                ], width=6)
            ]),
            dbc.Row([
                dbc.Col([
                    html.Label("Trong khoảng thời gian"),
                    dcc.Dropdown(
                        id="percent-timeframe",
                        options=[
                            {"label": "Trong ngày", "value": "day"},
                            {"label": "Trong tuần", "value": "week"},
                            {"label": "Trong tháng", "value": "month"}
                        ],
                        value="day"
                    )
                ], width=12)
            ], className="mt-2")
        ])

    elif alert_type == "technical":
        return html.Div([
            html.Label("Chọn chỉ báo kỹ thuật"),
            dcc.Dropdown(
                id="technical-indicator",
                options=[
                    {"label": "Golden Cross (MA20 cắt lên MA50)", "value": "golden_cross"},
                    {"label": "Death Cross (MA20 cắt xuống MA50)", "value": "death_cross"},
                    {"label": "RSI vào vùng quá bán (<30)", "value": "rsi_oversold"},
                    {"label": "RSI vào vùng quá mua (>70)", "value": "rsi_overbought"},
                    {"label": "MACD cắt lên Signal", "value": "macd_bullish_cross"},
                    {"label": "MACD cắt xuống Signal", "value": "macd_bearish_cross"},
                    {"label": "Giá phá vỡ dải trên Bollinger", "value": "bb_upper_break"},
                    {"label": "Giá phá vỡ dải dưới Bollinger", "value": "bb_lower_break"}
                ],
                value="golden_cross"
            )
        ])

# Callback để hiển thị tùy chọn email
@app.callback(
    Output("email-options-container", "children"),
    [Input("alert-method", "value")]
)
def update_email_options(methods):
    if "email" in methods:
        return html.Div([
            html.Label("Địa chỉ email", className="mt-3"),
            dbc.Input(id="alert-email", type="email", placeholder="Nhập địa chỉ email của bạn")
        ])
    return html.Div()

# Tạo danh sách cảnh báo (trong thực tế sẽ lưu vào cơ sở dữ liệu)
alert_list = []

# Callback để tạo cảnh báo mới
@app.callback(
    Output("active-alerts", "children"),
    [Input("create-alert", "n_clicks")],
    [
        State("alert-ticker", "value"),
        State("alert-type", "value"),
        State("alert-method", "value"),
        State("price-condition", "value") if "price-condition" in app.callback_context.inputs else None,
        State("price-target", "value") if "price-target" in app.callback_context.inputs else None,
        State("percent-condition", "value") if "percent-condition" in app.callback_context.inputs else None,
        State("percent-target", "value") if "percent-target" in app.callback_context.inputs else None,
        State("percent-timeframe", "value") if "percent-timeframe" in app.callback_context.inputs else None,
        State("technical-indicator", "value") if "technical-indicator" in app.callback_context.inputs else None,
        State("alert-email", "value") if "alert-email" in app.callback_context.inputs else None
    ],
    prevent_initial_call=True
)
def create_alert(n_clicks, ticker, alert_type, methods, price_cond=None, price_target=None,
                pct_cond=None, pct_target=None, pct_timeframe=None, tech_indicator=None, email=None):
    if n_clicks is None:
        return html.Div("Chưa có cảnh báo nào được thiết lập")

    # Lấy giá hiện tại
    try:
        current_data = yf.Ticker(ticker).history(period="1d")
        current_price = current_data['Close'].iloc[-1]
    except:
        current_price = 0

    # Tạo cảnh báo mới
    new_alert = {
        "id": len(alert_list) + 1,
        "ticker": ticker,
        "type": alert_type,
        "methods": methods,
        "created_at": datetime.now().strftime("%Y-%m-%d %H:%M"),
        "status": "Active"
    }

    # Thêm thông tin chi tiết dựa trên loại cảnh báo
    if alert_type == "price":
        new_alert["condition"] = price_cond
        new_alert["target"] = price_target
        new_alert["description"] = f"{ticker} {price_cond} ${price_target}"

    elif alert_type == "percent":
        new_alert["condition"] = pct_cond
        new_alert["target"] = pct_target
        new_alert["timeframe"] = pct_timeframe
        direction = "tăng" if pct_cond == "increase" else "giảm"
        timeframe_text = {"day": "trong ngày", "week": "trong tuần", "month": "trong tháng"}[pct_timeframe]
        new_alert["description"] = f"{ticker} {direction} {pct_target}% {timeframe_text}"

    elif alert_type == "technical":
        new_alert["indicator"] = tech_indicator
        indicator_descriptions = {
            "golden_cross": "Golden Cross (MA20 cắt lên MA50)",
            "death_cross": "Death Cross (MA20 cắt xuống MA50)",
            "rsi_oversold": "RSI vào vùng quá bán (<30)",
            "rsi_overbought": "RSI vào vùng quá mua (>70)",
            "macd_bullish_cross": "MACD cắt lên Signal",
            "macd_bearish_cross": "MACD cắt xuống Signal",
            "bb_upper_break": "Giá phá vỡ dải trên Bollinger",
            "bb_lower_break": "Giá phá vỡ dải dưới Bollinger"
        }
        new_alert["description"] = f"{ticker} - {indicator_descriptions[tech_indicator]}"

    # Thêm email nếu có
    if "email" in methods and email:
        new_alert["email"] = email

    # Thêm cảnh báo vào danh sách
    alert_list.append(new_alert)

    # Hiển thị danh sách cảnh báo
    return display_alerts()

# Hiển thị danh sách cảnh báo
def display_alerts():
    if not alert_list:
        return html.Div("Chưa có cảnh báo nào được thiết lập")

    alert_cards = []
    for alert in alert_list:
        # Màu sắc dựa trên loại cảnh báo
        if alert["type"] == "price":
            color = "info"
        elif alert["type"] == "percent":
            color = "warning"
        else:  # technical
            color = "success"

        # Tạo card cho cảnh báo
        card = dbc.Card([
            dbc.CardHeader(
                html.H5(f"Cảnh báo #{alert['id']} - {alert['ticker']}", className="mb-0")
            ),
            dbc.CardBody([
                html.P(alert["description"]),
                html.P(f"Trạng thái: {alert['status']}", className="text-muted"),
                html.P(f"Tạo lúc: {alert['created_at']}", className="text-muted small"),
                html.P(f"Phương thức: {', '.join(alert['methods'])}", className="text-muted small"),
                dbc.Button("Xóa", id=f"delete-alert-{alert['id']}", color="danger", size="sm",
                          className="mt-2")
            ])
        ], color=color, outline=True, className="mb-3")

        alert_cards.append(card)

    return html.Div(alert_cards)
3. Xuất báo cáo và phân tích
# Thêm tab phân tích và báo cáo
reports_tab = dbc.Tab([
dbc.Row([
dbc.Col([
html.H4("Tạo báo cáo phân tích", className="mb-4"),
html.H5("Chọn mã chứng khoán"),
dcc.Dropdown(
id="report-ticker",
options=[{"label": ticker, "value": ticker} for ticker in tech_tickers],
placeholder="Chọn mã chứng khoán",
value="AAPL"
),
html.H5("Khoảng thời gian", className="mt-3"),
dcc.Dropdown(
id="report-timeframe",
options=[
{"label": "1 tháng", "value": "1mo"},
{"label": "3 tháng", "value": "3mo"},
{"label": "6 tháng", "value": "6mo"},
{"label": "1 năm", "value": "1y"},
{"label": "2 năm", "value": "2y"},
{"label": "5 năm", "value": "5y"}
],
value="1y"
),
html.H5("Loại phân tích", className="mt-3"),
dcc.Checklist(
id="report-analysis-types",
options=[
{"label": "Phân tích giá", "value": "price"},
{"label": "Phân tích kỹ thuật", "value": "technical"},
{"label": "Phân tích so sánh", "value": "comparison"},
{"label": "Phân tích ngành", "value": "sector"}
],
value=["price", "technical"]
),
dbc.Button("Tạo báo cáo", id="generate-report", color="primary", className="mt-4")
], width=3),
dbc.Col([
dcc.Loading(
id="report-loading",
type="circle",
children=[html.Div(id="report-content")]
)
], width=9)
])
], label="Báo cáo & Phân tích")
# Thêm tab vào tabs
# (Cập nhật phần layout để thêm tab này)
# Callback để tạo báo cáo
@app.callback(
Output("report-content", "children"),
[Input("generate-report", "n_clicks")],
[
State("report-ticker", "value"),
State("report-timeframe", "value"),
State("report-analysis-types", "value")
],
prevent_initial_call=True
)
def generate_report(n_clicks, ticker, timeframe, analysis_types):
if n_clicks is None:
return html.Div("Chọn các tùy chọn và nhấn 'Tạo báo cáo'")
report_sections = []
# Thông tin chung về cổ phiếu
try:
stock = yf.Ticker(ticker)
info = stock.info
company_name = info.get('longName', ticker)
# Header
report_sections.append(html.Div([
html.H3(f"Báo cáo phân tích: {company_name} ({ticker})"),
html.P(f"Ngày tạo: {datetime.now().strftime('%Y-%m-%d')}"),
html.P(f"Khoảng thời gian: {timeframe}"),
html.Hr()
]))
# Thông tin cơ bản
basic_info = html.Div([
html.H4("Thông tin cơ bản"),
dbc.Row([
dbc.Col([
html.P(f"Ngành: {info.get('sector', 'N/A')}"),
html.P(f"Lĩnh vực: {info.get('industry', 'N/A')}"),
html.P(f"Quốc gia: {info.get('country', 'N/A')}"),
], width=6),
dbc.Col([
html.P(f"Vốn hóa: ${info.get('marketCap', 0)/1e9:.2f}B"),
html.P(f"P/E: {info.get('trailingPE', 'N/A')}"),
html.P(f"Tỷ lệ cổ tức: {info.get('dividendYield', 0)*100:.2f}%"),
], width=6)
]),
html.Hr()
])
report_sections.append(basic_info)
except:
# Header đơn giản nếu không lấy được thông tin
report_sections.append(html.Div([
html.H3(f"Báo cáo phân tích: {ticker}"),
html.P(f"Ngày tạo: {datetime.now().strftime('%Y-%m-%d')}"),
html.P(f"Khoảng thời gian: {timeframe}"),
html.Hr()
]))
# Phân tích giá
if "price" in analysis_types:
try:
df = get_stock_data(ticker, period=timeframe)
# Tính toán % thay đổi
price_change = (df['Close'].iloc[-1] / df['Close'].iloc[0] - 1) * 100
color = "text-success" if price_change >= 0 else "text-danger"
# Tạo biểu đồ giá
fig = go.Figure(
go.Candlestick(
x=df.index,
open=df['Open'],
high=df['High'],
low=df['Low'],
close=df['Close'],
name="OHLC"
)
)
fig.update_layout(
title=f"Biểu đồ giá {ticker}",
xaxis_title="Ngày",
yaxis_title="Giá ($)",
height=500,
xaxis_rangeslider_visible=False
)
price_analysis = html.Div([
html.H4("Phân tích giá"),
dbc.Row([
dbc.Col([
html.P(f"Giá hiện tại: ${df['Close'].iloc[-1]:.2f}"),
html.P([
"Thay đổi: ",
html.Span(f"{price_change:.2f}%", className=color)
]),
html.P(f"Cao nhất: ${df['High'].max():.2f}"),
html.P(f"Thấp nhất: ${df['Low'].min():.2f}")
], width=4),
dbc.Col([
dcc.Graph(figure=fig)
], width=8)
]),
# Phân tích xu hướng
html.H5("Xu hướng giá", className="mt-3"),
html.P(f"Xu hướng hiện tại: {'Tăng' if price_change > 0 else 'Giảm'}"),
# Mức hỗ trợ và kháng cự (đơn giản)
html.H5("Mức hỗ trợ và kháng cự", className="mt-3"),
html.P(f"Kháng cự: ${df['High'].nlargest(3).mean():.2f}"),
html.P(f"Hỗ trợ: ${df['Low'].nsmallest(3).mean():.2f}"),
html.Hr()
])
report_sections.append(price_analysis)
except:
report_sections.append(html.Div([
html.H4("Phân tích giá"),
html.P("Không thể tải dữ liệu giá cho mã này"),
html.Hr()
]))
# Phân tích kỹ thuật
if "technical" in analysis_types:
try:
df = get_stock_data(ticker, period=timeframe)
df = add_technical_indicators(df)
# Tạo biểu đồ chỉ báo kỹ thuật
fig = make_subplots(rows=3, cols=1, shared_xaxes=True,
vertical_spacing=0.1, subplot_titles=('Giá và MA', 'RSI', 'MACD'),
row_heights=[0.5, 0.25, 0.25])
# Thêm giá và MA
fig.add_trace(
go.Candlestick(
x=df.index,
open=df['Open'],
high=df['High'],
low=df['Low'],
close=df['Close'],
name="OHLC"
), row=1, col=1
)
fig.add_trace(go.Scatter(x=df.index, y=df['SMA20'], mode='lines', name='SMA20'),
row=1, col=1)
fig.add_trace(go.Scatter(x=df.index, y=df['SMA50'], mode='lines', name='SMA50'),
row=1, col=1)
# Thêm RSI
fig.add_trace(go.Scatter(x=df.index, y=df['RSI'], mode='lines', name='RSI'),
row=2, col=1)
fig.add_hline(y=70, line_dash="dash", line_color="red", row=2, col=1)
fig.add_hline(y=30, line_dash="dash", line_color="green", row=2, col=1)
# Thêm MACD
fig.add_trace(go.Scatter(x=df.index, y=df['MACD'], mode='lines', name='MACD'),
row=3, col=1)
fig.add_trace(go.Scatter(x=df.index, y=df['MACD_Signal'], mode='lines', name='Signal'),
row=3, col=1)
# Cập nhật layout
fig.update_layout(
title="Phân tích kỹ thuật",
height=800,
xaxis_rangeslider_visible=False,
showlegend=True,
legend=dict(orientation="h", y=1.02)
)
# Tìm các tín hiệu kỹ thuật gần đây
recent_df = df.tail(20)
signals = []
# Kiểm tra MA Cross
for i in range(1, len(recent_df)):
if (recent_df['SMA20'].iloc[i-1] <= recent_df['SMA50'].iloc[i-1] and
recent_df['SMA20'].iloc[i] > recent_df['SMA50'].iloc[i]):
signals.append({"type": "Golden Cross", "date": recent_df.index[i].strftime("%Y-%m-%d")})
if (recent_df['SMA20'].iloc[i-1] >= recent_df['SMA50'].iloc[i-1] and
recent_df['SMA20'].iloc[i] < recent_df['SMA50'].iloc[i]):
signals.append({"type": "Death Cross", "date": recent_df.index[i].strftime("%Y-%m-%d")})
# Kiểm tra RSI
if recent_df['RSI'].iloc[-1] < 30:
signals.append({"type": "RSI Quá bán", "date": recent_df.index[-1].strftime("%Y-%m-%d")})
if recent_df['RSI'].iloc[-1] > 70:
signals.append({"type": "RSI Quá mua", "date": recent_df.index[-1].strftime("%Y-%m-%d")})
# Kiểm tra MACD
for i in range(1, len(recent_df)):
if (recent_df['MACD'].iloc[i-1] <= recent_df['MACD_Signal'].iloc[i-1] and
recent_df['MACD'].iloc[i] > recent_df['MACD_Signal'].iloc[i]):
signals.append({"type": "MACD Bullish Cross", "date": recent_df.index[i].strftime("%Y-%m-%d")})
if (recent_df['MACD'].iloc[i-1] >= recent_df['MACD_Signal'].iloc[i-1] and
recent_df['MACD'].iloc[i] < recent_df['MACD_Signal'].iloc[i]):
signals.append({"type": "MACD Bearish Cross", "date": recent_df.index[i].strftime("%Y-%m-%d")})
# Tạo bảng tín hiệu
if signals:
signal_table = dbc.Table(
[
html.Thead(html.Tr([html.Th("Tín hiệu"), html.Th("Ngày")])),
html.Tbody([html.Tr([html.Td(s["type"]), html.Td(s["date"])]) for s in signals])
],
bordered=True, hover=True, striped=True, size="sm"
)
else:
signal_table = html.P("Không tìm thấy tín hiệu kỹ thuật trong 20 phiên gần đây")
technical_analysis = html.Div([
html.H4("Phân tích kỹ thuật"),
dcc.Graph(figure=fig),
html.H5("Các tín hiệu kỹ thuật gần đây", className="mt-3"),
signal_table,
# Kết luận kỹ thuật
html.H5("Kết luận kỹ thuật", className="mt-3"),
html.P([
"Xu hướng trung hạn: ",
html.Span(
"Tăng" if df['SMA20'].iloc[-1] > df['SMA50'].iloc[-1] else "Giảm",
className="text-success" if df['SMA20'].iloc[-1] > df['SMA50'].iloc[-1] else "text-danger"
)
]),
html.P([
"Tín hiệu RSI: ",
html.Span(
"Quá mua" if df['RSI'].iloc[-1] > 70 else "Quá bán" if df['RSI'].iloc[-1] < 30 else "Trung tính",
className="text-danger" if df['RSI'].iloc[-1] > 70 else "text-success" if df['RSI'].iloc[-1] < 30 else ""
)
]),
html.P([
"Tín hiệu MACD: ",
html.Span(
"Tích cực" if df['MACD'].iloc[-1] > df['MACD_Signal'].iloc[-1] else "Tiêu cực",
className="text-success" if df['MACD'].iloc[-1] > df['MACD_Signal'].iloc[-1] else "text-danger"
)
]),
html.Hr()
])
report_sections.append(technical_analysis)
except:
report_sections.append(html.Div([
html.H4("Phân tích kỹ thuật"),
html.P("Không thể tải dữ liệu kỹ thuật cho mã này"),
html.Hr()
]))
# Phân tích so sánh
if "comparison" in analysis_types:
try:
# Lấy dữ liệu của mã cần phân tích và S&P 500
stock_data = get_stock_data(ticker, period=timeframe)
market_data = get_stock_data("^GSPC", period=timeframe) # S&P 500
# Tính toán % thay đổi so với đầu kỳ
stock_change = (stock_data['Close'] / stock_data['Close'].iloc[0]) * 100 - 100
market_change = (market_data['Close'] / market_data['Close'].iloc[0]) * 100 - 100
# Tạo biểu đồ so sánh
fig = go.Figure()
fig.add_trace(go.Scatter(x=stock_data.index, y=stock_change, mode='lines', name=ticker))
fig.add_trace(go.Scatter(x=market_data.index, y=market_change, mode='lines', name="S&P 500"))
fig.update_layout(
title=f"So sánh hiệu suất: {ticker} vs S&P 500",
xaxis_title="Ngày",
yaxis_title="% Thay đổi",
height=500,
hovermode='x unified'
)
# Tính Alpha (hiệu suất vượt trội so với thị trường)
alpha = stock_change.iloc[-1] - market_change.iloc[-1]
alpha_color = "text-success" if alpha > 0 else "text-danger"
# Tính Beta (độ nhạy cảm với thị trường)
stock_returns = stock_data['Close'].pct_change().dropna()
market_returns = market_data['Close'].pct_change().dropna()
# Đảm bảo cùng độ dài
min_len = min(len(stock_returns), len(market_returns))
stock_returns = stock_returns[-min_len:]
market_returns = market_returns[-min_len:]
beta = np.cov(stock_returns, market_returns)[0, 1] / np.var(market_returns)
comparison_analysis = html.Div([
html.H4("Phân tích so sánh"),
dcc.Graph(figure=fig),
dbc.Row([
dbc.Col([
html.P([
f"{ticker} vs S&P 500: ",
html.Span(
f"{alpha:.2f}%",
className=alpha_color
)
]),
html.P(f"Beta: {beta:.2f}")
], width=6),
dbc.Col([
html.P(f"Hiệu suất {ticker}: {stock_change.iloc[-1]:.2f}%"),
html.P(f"Hiệu suất S&P 500: {market_change.iloc[-1]:.2f}%")
], width=6)
]),
html.Hr()
])
report_sections.append(comparison_analysis)
except:
report_sections.append(html.Div([
html.H4("Phân tích so sánh"),
html.P("Không thể tải dữ liệu so sánh cho mã này"),
html.Hr()
]))
# Phân tích ngành
if "sector" in analysis_types:
try:
# Lấy thông tin ngành từ thông tin cổ phiếu
sector = info.get('sector', '')
if sector:
# Danh sách các ETF theo ngành
sector_etfs = {
"Technology": "XLK",
"Financial": "XLF",
"Healthcare": "XLV",
"Consumer Cyclical": "XLY",
"Consumer Defensive": "XLP",
"Energy": "XLE",
"Utilities": "XLU",
"Real Estate": "XLRE",
"Industrials": "XLI",
"Basic Materials": "XLB",
"Communication Services": "XLC"
}
# Lấy ETF tương ứng với ngành
etf_ticker = sector_etfs.get(sector, None)
if etf_ticker:
# Lấy dữ liệu ETF ngành
etf_data = get_stock_data(etf_ticker, period=timeframe)
# Tính % thay đổi
etf_change = (etf_data['Close'].iloc[-1] / etf_data['Close'].iloc[0] - 1) * 100
# Tạo biểu đồ so sánh với ngành
fig = go.Figure()
fig.add_trace(go.Scatter(x=stock_data.index, y=stock_change, mode='lines', name=ticker))
fig.add_trace(go.Scatter(x=etf_data.index, y=(etf_data['Close'] / etf_data['Close'].iloc[0]) * 100 - 100, mode='lines', name=f"{sector} (ETF: {etf_ticker})"))
fig.update_layout(
title=f"So sánh với ngành {sector}",
xaxis_title="Ngày",
yaxis_title="% Thay đổi",
height=500,
hovermode='x unified'
)
# Tính hiệu suất tương đối so với ngành
relative_performance = stock_change.iloc[-1] - etf_change
perf_color = "text-success" if relative_performance > 0 else "text-danger"
sector_analysis = html.Div([
html.H4("Phân tích ngành"),
dcc.Graph(figure=fig),
dbc.Row([
dbc.Col([
html.P([
f"Hiệu suất so với ngành: ",
html.Span(
f"{relative_performance:.2f}%",
className=perf_color
)
]),
html.P(f"Vị thế trong ngành: {'Vượt trội' if relative_performance > 0 else 'Kém hơn'}")
], width=6),
dbc.Col([
html.P(f"Hiệu suất {ticker}: {stock_change.iloc[-1]:.2f}%"),
html.P(f"Hiệu suất ngành {sector}: {etf_change:.2f}%")
], width=6)
]),
html.Hr()
])
report_sections.append(sector_analysis)
else:
report_sections.append(html.Div([
html.H4("Phân tích ngành"),
html.P(f"Không tìm thấy ETF cho ngành {sector}"),
html.Hr()
]))
else:
report_sections.append(html.Div([
html.H4("Phân tích ngành"),
html.P("Không tìm thấy thông tin ngành cho mã này"),
html.Hr()
]))
except:
report_sections.append(html.Div([
html.H4("Phân tích ngành"),
html.P("Không thể tải dữ liệu ngành cho mã này"),
html.Hr()
]))
# Nút xuất báo cáo PDF
export_button = dbc.Button("Xuất báo cáo PDF", id="export-pdf", color="success", className="mt-3")
report_sections.append(export_button)
return html.Div(report_sections)
VIII. Kết luận
Xây dựng một bảng điều khiển theo dõi thị trường với Dash và Plotly là một cách hiệu quả để tạo ra một công cụ phân tích thị trường mạnh mẽ mà không cần kiến thức chuyên sâu về phát triển web. Với hệ thống như vậy, các nhà đầu tư và giao dịch viên có thể:
- Theo dõi thị trường thời gian thực với các biểu đồ tương tác và chỉ báo kỹ thuật
- Phân tích kỹ thuật thông qua nhiều chỉ báo và công cụ
- So sánh hiệu suất của các mã cổ phiếu khác nhau
- Thiết lập cảnh báo để không bỏ lỡ các cơ hội giao dịch
- Tạo báo cáo phân tích toàn diện
Dash và Plotly cung cấp một nền tảng linh hoạt và mạnh mẽ để xây dựng các ứng dụng phân tích dữ liệu tương tác, đặc biệt phù hợp cho phân tích tài chính. Khả năng kết hợp mã Python thuần túy với các thành phần web tương tác giúp đơn giản hóa quá trình phát triển, cho phép tập trung vào logic phân tích thay vì chi tiết triển khai giao diện người dùng.
Mặc dù bài viết này đã trình bày một bảng điều khiển khá toàn diện, bạn vẫn có thể mở rộng và tùy chỉnh thêm dựa trên nhu cầu cụ thể của mình, như thêm các chiến lược giao dịch tự động, tích hợp với API của sàn giao dịch thực, hay áp dụng các mô hình học máy phức tạp hơn cho việc dự đoán thị trường.