Đánh giá hiệu suất: từ Sharpe Ratio đến Sortino và Omega Ratio
2025-06-08 — Admin
Tóm tắt nhanh: Đánh giá hiệu suất: từ Sharpe Ratio đến Sortino và Omega Ratio
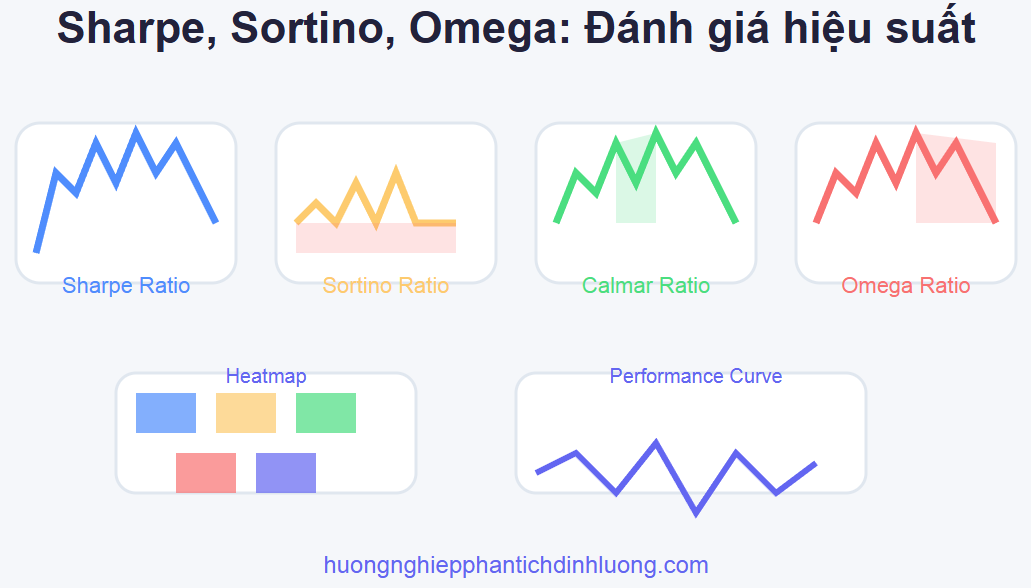
Đánh giá hiệu suất là bước quan trọng để so sánh và tối ưu hóa các chiến lược giao dịch. Ngoài Sharpe Ratio truyền thống, các chỉ số như Sortino, Calmar, Omega giúp đánh giá tốt hơn trong điều kiện thị trường biến động mạnh hoặc tail-heavy.
1. Sharpe Ratio: Ưu và nhược điểm
- Sharpe Ratio = (Return - Risk-free rate) / Std(returns)
- Đo lường lợi nhuận trên mỗi đơn vị rủi ro tổng thể (bao gồm cả upside và downside volatility)
- Ưu điểm: Đơn giản, phổ biến, dễ so sánh giữa các chiến lược
- Nhược điểm: Không phân biệt upside/downside risk, dễ bị méo khi thị trường có tail risk hoặc biến động mạnh
Ví dụ Python:
import numpy as np
def sharpe_ratio(returns, rf=0):
    excess = returns - rf
    return np.mean(excess) / np.std(excess)
2. Sortino, Calmar, Omega cho tail-heavy strategies
- Sortino Ratio: Chỉ tính downside volatility (rủi ro lỗ)
- Sortino = (Return - Risk-free rate) / Std(negative returns)
- Calmar Ratio: Lợi nhuận trung bình chia cho max drawdown
- Omega Ratio: Tỷ lệ xác suất lợi nhuận vượt ngưỡng so với xác suất lỗ vượt ngưỡng
Ví dụ Python:
# Sortino Ratio
import numpy as np
def sortino_ratio(returns, rf=0):
    downside = returns[returns < rf]
    return (np.mean(returns) - rf) / (np.std(downside) if len(downside) > 0 else 1)

# Calmar Ratio
def calmar_ratio(returns):
    max_dd = np.max(np.maximum.accumulate(returns) - returns)
    return np.mean(returns) / (max_dd if max_dd != 0 else 1)

# Omega Ratio
def omega_ratio(returns, threshold=0):
    gain = returns[returns > threshold]
    loss = -returns[returns < threshold]
    return (np.sum(gain) / len(returns)) / (np.sum(loss) / len(returns) if np.sum(loss) > 0 else 1)
3. Visualization: heatmap và performance curve
- Heatmap: So sánh các ratio giữa nhiều chiến lược/portfolio
- Performance curve: Đường tích lũy lợi nhuận, drawdown
Ví dụ heatmap:
import seaborn as sns
import pandas as pd
import matplotlib.pyplot as plt
ratios = pd.DataFrame({
    'Sharpe': [1.2, 0.8, 1.5],
    'Sortino': [1.5, 1.0, 2.0],
    'Calmar': [0.6, 0.4, 0.8],
    'Omega': [1.3, 1.1, 1.6]
}, index=['Strategy A', 'Strategy B', 'Strategy C'])
sns.heatmap(ratios, annot=True, cmap='YlGnBu')
plt.title('Performance Ratios Heatmap')
plt.show()
Ví dụ performance curve:
plt.plot(np.cumsum(returns))
plt.title('Cumulative Returns')
plt.xlabel('Time')
plt.ylabel('Cumulative Return')
plt.show()
Tổng kết
- Sharpe Ratio phù hợp cho thị trường ổn định, ít tail risk
- Sortino, Calmar, Omega giúp đánh giá tốt hơn khi thị trường biến động mạnh
- Visualization giúp so sánh hiệu suất đa chiều, chọn chiến lược tối ưu
Chúc bạn tối ưu hóa hiệu suất chiến lược giao dịch!